
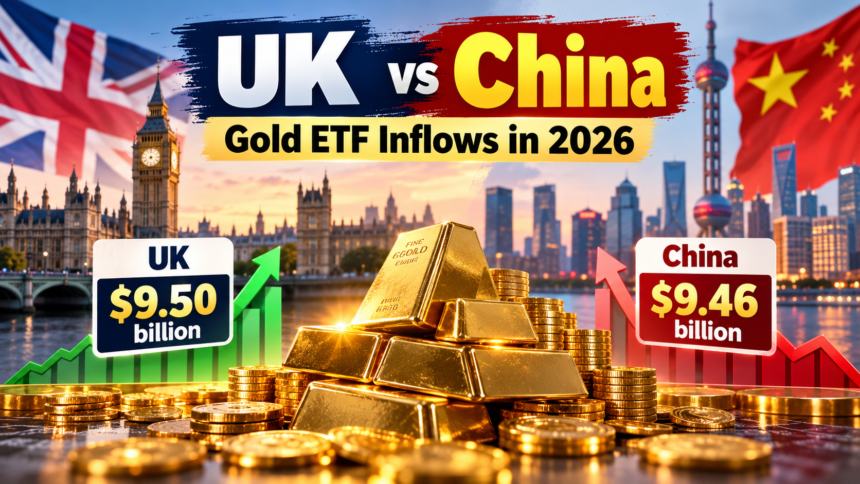
The UK attracted $9.50 billion in net inflows into listed gold exchange-traded funds (ETFs) between January and September 2026, narrowly surpassing China’s $9.46 billion, according to the World Gold Council’s (WGC) Gold ETF Commentary: September 2026.
The UK moved ahead following an exceptionally strong third quarter, during which its listed gold funds attracted approximately $7.5 billion, equivalent to 54 tonnes of gold. These were the strongest quarterly inflows on record for UK-listed funds, helping Europe register record regional inflows of $13.64 billion.
Demand also remained consistent throughout the period. UK-listed gold ETFs recorded inflows in 12 of the 13 weeks leading up to September 25, marking their most sustained run of weekly inflows since 2022. This pattern suggests that investor interest continued beyond a single market event.
UK vs China: Gold ETF Inflows in 2026
The figures show that the UK edged ahead of China in cumulative gold ETF inflows during the first nine months of 2026. The UK’s third-quarter performance was particularly strong, while China’s funds continued to contribute significantly to Asian gold ETF demand.
| Indicator | UK | China |
|---|---|---|
| Year-to-date ETF inflows (January–September 2026) | $9.50 billion | $9.46 billion |
| Q3 ETF inflows | Approximately $7.5 billion | Not specified in the report |
| Q3 gold demand | 54 tonnes | Not specified in the report |
| Key trend | Strongest quarterly inflows on record | Continued inflows amid weakness in domestic equities |
| Notable development | Inflows in 12 of 13 weeks through September 25 | Major contributor to Asian gold ETF demand |
Source: World Gold Council, Gold ETF Commentary: September 2026.
Fiscal Concerns May Be Supporting Gold Demand
The World Gold Council said it was difficult to identify a single explanation for the UK’s unusually strong gold ETF inflows. However, rising term premiums on government bonds may offer a possible indication of what was driving investor behaviour.
A bond term premium refers to the additional compensation investors demand for holding longer-term government bonds instead of repeatedly investing in shorter-term securities. An increase in this premium can reflect concerns about inflation uncertainty, the sustainability of government finances and the risks associated with public borrowing.
According to the WGC, UK gold ETF inflows above the levels predicted by its historical model began moving alongside changes in the country’s government bond term premium from July onwards. The relationship had been relatively weak earlier in the year but became more pronounced during the third quarter.
A model based on historical relationships between UK and Western gold ETF flows had projected quarterly UK inflows of approximately 18 tonnes. However, actual inflows reached 54 tonnes, leaving a difference of 36 tonnes that the model could not explain.
The unexplained gap remained largely unchanged even after the council considered additional UK economic and financial indicators. This suggests that factors beyond the variables included in the model may have contributed to the unusually strong demand.
The WGC cautioned that the sample was limited and that the relationship did not establish a direct cause. Nevertheless, investors may have been responding to uncertainty over inflation, concerns about government finances or perceptions that monetary policy was not keeping pace with economic developments.
Key Figures Behind the Gold ETF Trend
The UK’s performance formed part of a broader increase in demand for gold ETFs across Europe. The regional figures also show how investment flows shifted between Europe and North America during the third quarter.
| Indicator | Data |
|---|---|
| Global gold ETF inflows in Q3 2026 | $30.74 billion |
| European gold ETF inflows in Q3 | $13.64 billion |
| North American gold ETF inflows in Q3 | $11.73 billion |
| UK Q3 inflows above model predictions | 36 tonnes |
| Model-predicted UK Q3 inflows | Approximately 18 tonnes |
| Actual UK Q3 inflows | 54 tonnes |
Source: World Gold Council, Gold ETF Commentary: September 2026 and Gold Market Commentary: Go with the Flow.
European gold ETFs attracted $13.64 billion during the third quarter, exceeding the $11.73 billion recorded in North America. It was the first quarter since the second quarter of 2021 in which Europe attracted larger inflows than North America while both regions recorded positive flows.
The increase in European demand coincided with rising government bond yields and term premiums in France and Germany. However, gold ETF inflows in those markets were less pronounced than in the UK.
October Could Reveal Whether the Trend Continues
The World Gold Council identified October as an important period for assessing whether the recent pattern of gold ETF demand would continue.
If government bond yields remain elevated despite reduced expectations of further monetary tightening, investors may be placing greater emphasis on underlying fiscal and inflation risks rather than focusing primarily on near-term interest rates.
The UK’s move ahead of China in year-to-date gold ETF inflows highlights how investment demand can shift across regions as concerns about government borrowing, inflation and bond markets evolve. Whether the trend continues will depend on how investors respond to changing economic and financial conditions.
Disclaimer
This article is intended for general informational and educational purposes. The figures and analysis are based on the supplied source material from the World Gold Council’s Gold ETF Commentary: September 2026 and Gold Market Commentary: Go with the Flow. The information should not be treated as financial or investment advice. Gold prices and ETF investments can fluctuate, and past market trends do not guarantee future performance. Readers should conduct independent research or consult a qualified financial adviser before making investment decisions.